Homing in on the Home Advantage

A recent piece on ESPNCricinfo analyses the DRS data and argues that cricket should do away with neutral umpires. I reanalyzed the data.
If a game is officiated by a home umpire, we expect the following:
- Hosts will appeal less often as they are likely to be happier with the decision in the first place
- When visitors appeal a decision, their success rate should be higher than that of the hosts. Visitors are appealing against an unfavorable call—a visiting player was unfairly given out, or they felt the host player was unfairly given not out. And we expect the visitors to get more bad calls.
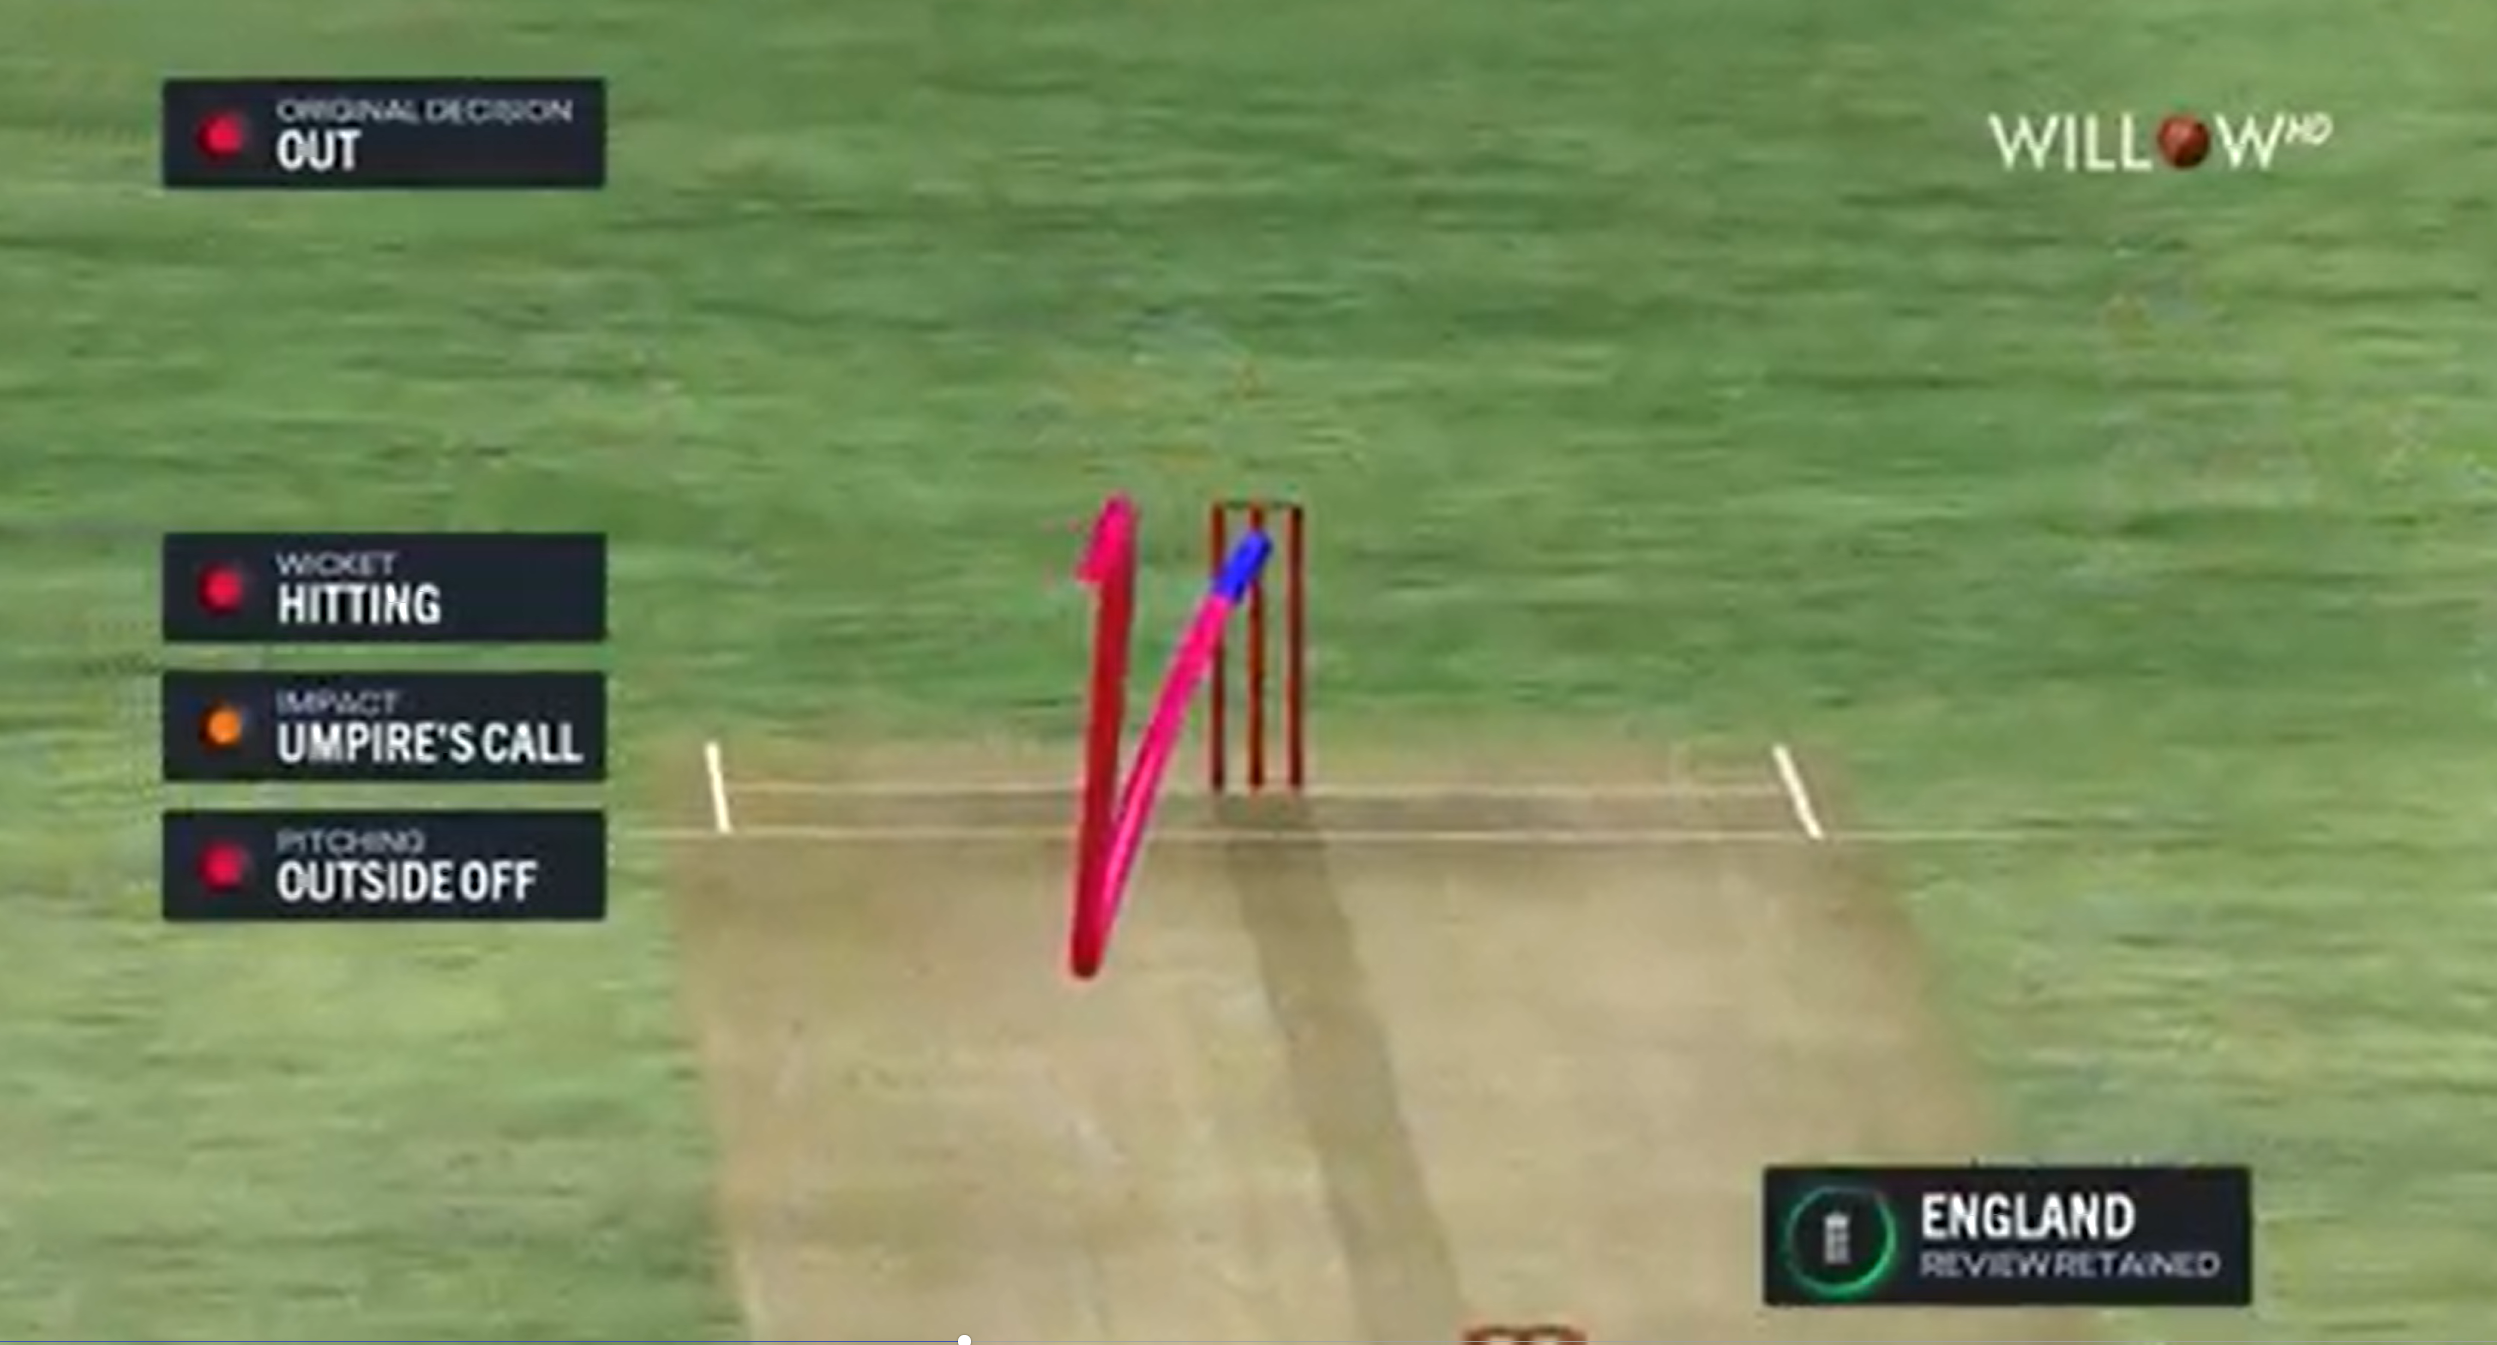
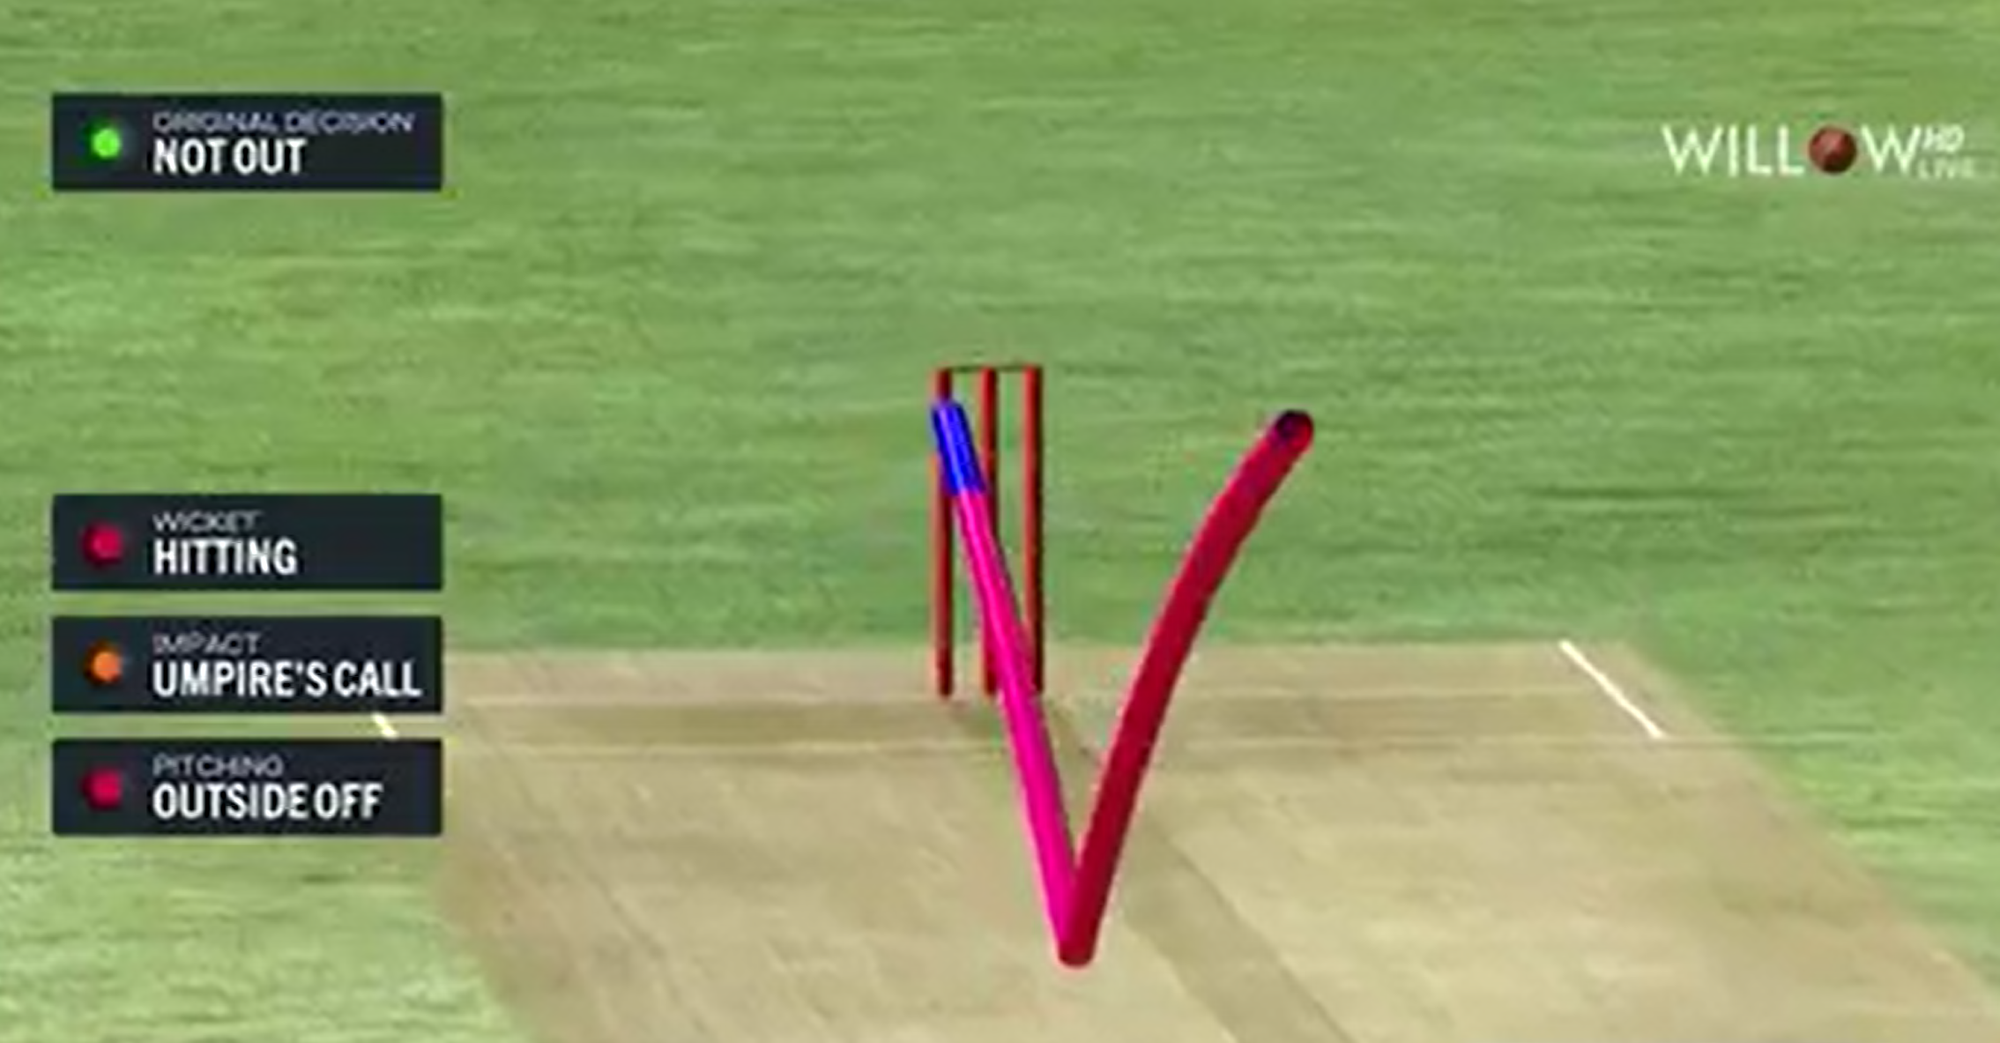
When analyzing success rate, I think it is best to ignore appeals that are struck down because they defer to the umpire’s call. Umpire’s call generally applies to LBW decisions, and especially two aspects of the LBW decision: 1. whether the ball was pitching in line, 2. whether it was hitting the wickets. To take a recent example, in the second test of the 2021 Ashes series, Lyon got a wicket when the impact was ‘umpire’s call’ and Stuart Broad was denied a wicket for the same reason.
Ollie Robinson Unsuccessfully Challenging the LBW Decision
Stuart Broad Unsuccessfully Challenging the Not-LBW Decision
With the preliminaries over, let’s get to the data covered in the article. Table 1 provides some summary statistics of the outcomes of DRS. As is clear, the visiting team appealed the umpire’s decision far more often than the home team: 303 vs. 264. Put another way, the visiting team lodged nearly one more appeal per test than the home team. So, how often did the appeals succeed? In line with our hypothesis, the home team's appeals were upheld less often (24%) than the visiting team’s appeals (29%).
Table 1. Review Outcomes Under Home Umpires. 41 Tests. July 2020–Nov. 2021.
| REVIEWER TYPE | TOTAL PLAYER REVIEWS | STRUCK DOWN (%) | UMPIRE’S CALL (STRUCK DOWN) (%) | UPHELD (%) |
| HOME BATTING | 96 | 39 (40%) | 25 (26%) | 32 (34%) |
| HOME BOWLING | 168 | 108 (64%) | 29 (18%) | 31 (18%) |
| VISITOR BATTING | 147 | 58 (39%) | 25 (17%) | 64 (44%) |
| VISITOR BOWLING | 156 | 97 (62%) | 34 (22%) | 25 (16%) |
Data From ESPNCricinfo
It could be the case that these results are a consequence of something to do with host vs. visitor rather than home umpires. For instance, hosts win a lot, and that generally means that they will bowl for shorter periods of time and bat for longer periods of time. We account for this by comparing outcomes under neutral umpires. The article has data on the same. There, you see that the visiting team makes fewer appeals (198) than the home team (214). And the visiting team’s success rate in appeals is slightly lower (29%) than the home team’s rate (30%).
p.s.
At the bottom of the article is another table that breaks down reviews by host country:
| HOST COUNTRY | TESTS | UMPIRES | REVIEWS | HOSTS’ SUCCESS (%) | VISITORS’ SUCCESS (%) |
| ENGLAND | 13 | AG WHARF, MA GOUGH*, RA KETTLEBOROUGH*, RK ILLINGWORTH* | 190 | 22/85 (26%) | 32/105 (30%) |
| NEW ZEALAND | 4 | CB GAFFANEY*, CM BROWN, WR KNIGHTS | 41 | 3/17 (18%) | 5/24 (21%) |
| AUSTRALIA | 4 | BNJ OXENFORD, P WILSON, PR REIFFEL* | 55 | 5/30 (17%) | 6/25 (24%) |
| SOUTH AFRICA | 2 | AT HOLDSTOCK, M ERASMUS* | 20 | 2/10 (20%) | 3/10 (30%) |
| SRI LANKA | 6 | HDPK DHARMASENA*, RSA PALLIYAGURUGE | 85 | 9/42 (21%) | 13/43 (30%) |
| PAKISTAN | 2 | AHSAN RAZA, ALEEM DAR* | 27 | 0/11 (0%) | 6/16 (38%) |
| INDIA | 5 | AK CHAUDHARY, NITIN MENON*, VK SHARMA | 87 | 9/40 (23%) | 11/47 (23%) |
| WEST INDIES | 6 | GO BRATHWAITE, JS WILSON* | 94 | 13/50 (26%) | 13/44 (29%) |
Data from ESPNCricinfo
But the data doesn’t match the data in the table above. For one, the number of tests considered is 42 rather than 41. For two, and perhaps relatedly, the total number of reviews is 599 rather than 567. To be comprehensive, let’s do the same calculations as above. The visiting team appeals more (314) than the host team (285). The host team's success rate is 22% (63/285), and the visiting team's success rate is 28% (89/314). If you were to do a statistical test for success rates:
prop.test(x = c(63, 89), n = c(285, 314))

        2-sample test for equality of proportions with continuity correction

data:  c(63, 89) out of c(285, 314)
X-squared = 2.7501, df = 1, p-value = 0.09725
alternative hypothesis: two.sided
95 percent confidence interval:
 -0.13505623  0.01028251
sample estimates:
   prop 1    prop 2
0.2210526 0.2834395


rather