Ceci N'est Pas une École

Asher, Jha, Novosad, Adukia, and Tan's NBER working paper is a major descriptive contribution. It links three national datasets at the level of the enumeration block, a unit of roughly 100 to 125 households (about 500 people), and builds a dataset covering 1.5 million neighborhoods and about 63% of India's population. The paper is conditionally accepted at the American Economic Review. It documents high residential segregation of Muslims and Scheduled Castes across Indian cities and villages, and shows that within towns, public facilities (schools, clinics) and household infrastructure (piped water, electricity, closed drainage) are systematically less present in blocks with higher Muslim or SC shares. The paper deserves to be read as the paper it actually is, not as the paper public discussion has turned it into.
The authors are explicit about scope: "Our analysis is descriptive. We document patterns of segregation and public service access, but do not disentangle discrimination, homophily, or other sorting mechanisms" (p. 2). The baseline regressions control for town fixed effects and log neighborhood population. They do not control for neighborhood income, consumption, education, housing density, or any other socioeconomic characteristic. Every coefficient in the main tables is a raw within-town association between group share and outcomes, unadjusted for neighborhood wealth. The paper does report some consumption-controlled results in the appendix.
This essay makes four arguments. First, the paper's facility-presence variables measure whether a school sits inside a 500-person block, not whether residents can reach one. The gap between hosting and access is larger than readers typically realize. Second, the paper's own Table 6 provides a natural falsification test that the paper does not use: private facilities, which are outside government control, show the same urban deficit as public ones, and the deficit reverses sign in rural areas. Both patterns point to poverty and urban form, not to discriminatory allocation. Third, the paper's most-cited Muslim infrastructure result, the within-town piped water gap, collapses to near zero once neighborhood consumption is controlled (Appendix Table A.5), and the paper's own decomposition (Figure 8) shows that the raw national comparison goes in the opposite direction: Muslim neighborhoods are more likely to have piped water. Fourth, the paper's public life, including the authors' own summary materials, is substantially disconnected from its current content, most consequentially in the continued circulation of education results the paper has withdrawn.
Hosting is not access
The paper's facility-presence variables measure whether a school or clinic is located inside a 500-person enumeration block. They do not measure distance to the nearest facility. The authors acknowledge this: "we observe neighborhood identifiers, but their geographic coordinates are not available to us" (paper, p. 10). They also note that urban residents "can travel across many enumeration blocks for work or access to public services" (paper, p. 10). The distinction between hosting a facility and having access to one matters most when the hosting rate is low, because a low rate means the typical catchment area spans many blocks. And the hosting rates are very low.
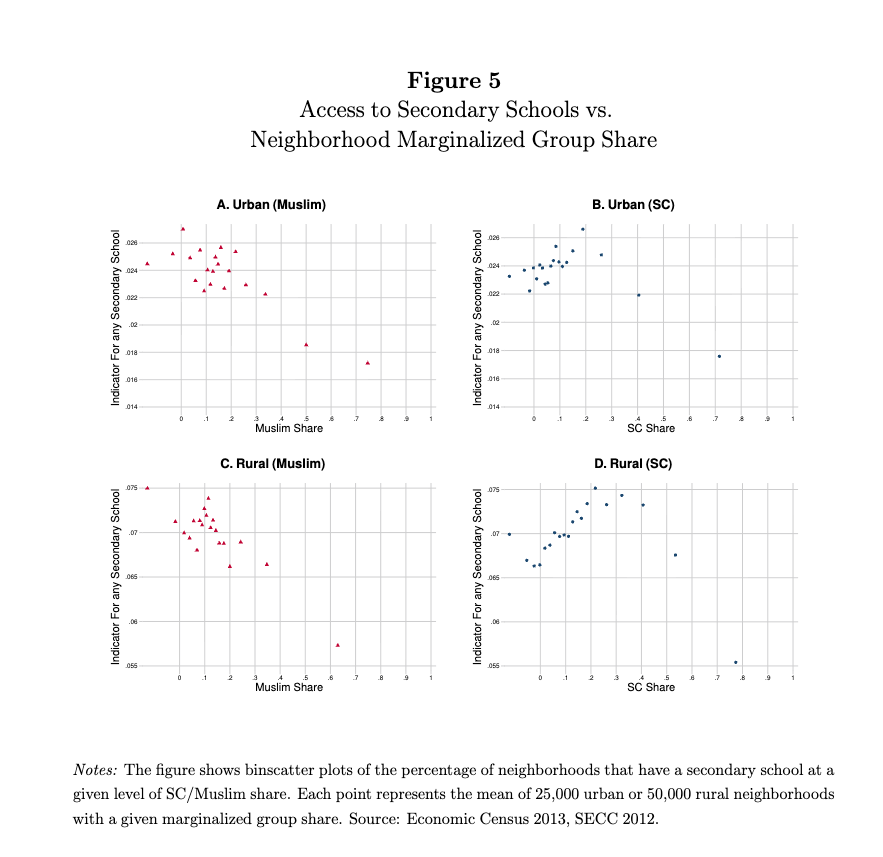
The mean probability that an urban block hosts a public secondary school is 0.02, and the mean for a public health facility is also 0.02 (Table 5). The paper's summary line, that a 100% Muslim neighborhood is "only half as likely to have a secondary school" (p. 3), is a halving of 2%, or about 1 percentage point. A 2% hosting rate implies roughly one school per 25,000 people, a catchment spanning dozens of blocks. The urban public primary school gap is smaller still: −0.4 pp on a 7% base. Rural public primary schools are a different case: the Muslim-share coefficient is −8.5 pp on a 33% base, a much larger absolute gap, though in rural areas blocks can correspond to entire villages separated by kilometers, so the hosting-access gap cuts differently there.
The paper presents all its coefficients as 0-to-100 comparisons: the gap between a neighborhood with no Muslims and one that is entirely Muslim. But the distribution of block-level Muslim share is bimodal (paper, Section 4). 26% of urban Muslims live in blocks above 80% Muslim, and over half live in blocks above 50% Muslim, but only about 10% of neighborhoods exceed 50% Muslim share. A linear regression on this distribution is comparing mean outcomes between two clusters: a large mass of low-Muslim-share blocks and a small number of high-Muslim-share blocks, with thin support in between. The 0-to-100 scaling presents this as a precisely estimated contrast between endpoints that contain very little data. A 50 pp change in Muslim share, which stays closer to where the data have support, implies gaps about half the headline size.
As you can see in Figure 5 Panel A, urban secondary school presence runs from about 0.014 to 0.026 on the y-axis. The points are clustered at the left with dense support, but above 0.6 Muslim share the handful of remaining points bounce erratically. The regression slope that generates the paper's headline is being pulled through this thin, noisy tail. The paper's Muslim identity measure comes from an LSTM classifier with 97% out-of-sample accuracy (paper, footnote 1). At 97% accuracy on 500-person blocks, roughly 15 people per block are miscoded. In a block with true Muslim share of 0.85, the measured share could range from 0.80 to 0.90. In the thin tail where the slope is being identified, classification noise of this magnitude could shift the binscatter points enough to materially alter the coefficient.
What the paper's own appendix does to its headline results
The paper's introduction leads with the Muslim infrastructure gaps: "Compared with a 0% Muslim neighborhood, a 100% Muslim neighborhood in the same city is 10% less likely to have piped water" (paper, p. 3). Every media write-up I found repeats this number. It sounds like direct evidence of unequal service delivery, because piped water and closed drainage are household-level measures that do not suffer from the hosting-versus-access problem that affects the school results.
The paper justifies its sparse controls in footnote 5: "Since our interest is in how ostensibly universal government services are allocated, we view the uncontrolled estimates as more relevant for our study" (paper, footnote 5, p. 3). Appendix Table A.4 adds slum indicators; the results are "virtually unchanged." But Appendix Table A.5 adds neighborhood consumption, and the Muslim infrastructure coefficients collapse. Piped water moves from −0.082 to +0.008. Closed drainage moves from −0.099 to +0.017. Electric light moves from −0.019 to +0.001 (paper, Appendix Table A.5). Once you account for the fact that Muslim neighborhoods are poorer, the Muslim infrastructure gap is essentially zero. The SC coefficients, by contrast, remain large and negative under the same control. This asymmetry is not flagged in the abstract, the introduction, or any media summary.
The paper's footnote 5 defense is that consumption might be a "bad control": if discrimination causes both segregation and poverty, conditioning on poverty removes part of the effect. That argument requires a causal framework, and the paper explicitly disclaims causal identification. In a descriptive paper, showing that Muslim blocks have less piped water and then showing in the appendix that this association is almost entirely explained by those blocks being poorer is not a robustness check. It is the main result. It tells you that the Muslim infrastructure gap is a poverty gap, not an independent religion gap. The paper presents it the other way around: the raw gap in the introduction, the consumption-controlled null in the appendix.
The private provision puzzle
The private-facility results in Table 6 are the most diagnostic part of the analysis. If the public-facility gaps reflect discriminatory government allocation, private facilities provide a natural falsification test. Private providers are outside government control and respond to demand and profitability. Under a discrimination story, they should partially fill the gap, entering where unmet demand creates profit. If instead private facilities show the same deficit as public ones, the pattern cannot be attributed specifically to government allocation. Something about the neighborhood itself is suppressing both.
The SC urban private-facility coefficients are enormous: −0.232 for private health facilities (77% relative decline on a 30% base), −0.062 for private secondary schools (78% decline on 8%), and −0.075 for private primary schools (54% decline on 14%) (Table 6). Private clinic operators locate based on expected revenue. One explanation is poverty: SC neighborhoods are poorer and private providers do not enter where purchasing power is low. The alternative is that private markets themselves discriminate, with providers refusing to locate in SC areas, non-SC customers avoiding them, or landlords refusing to rent commercial space. That alternative has support in the qualitative literature on caste, but it requires mechanisms beyond competitive entry, while the poverty explanation does not.
The Muslim urban gaps are roughly half the SC gaps: −0.093 for private health facilities (31% decline), −0.055 for private secondary schools (69% decline), −0.037 for private primary schools (26% decline). If poverty is the parsimonious explanation for SC private-facility deficits, it is more parsimonious still for Muslim deficits, where private-market discrimination against customers lacks even the qualitative support that caste-based exclusion has.
The rural results sharpen the diagnosis. In rural high-Muslim-share blocks, private primary schools are 1.6 pp more common and private health facilities 2.8 pp more common (Table 6). The sign flips. If Muslim demand were uniformly low, or if private providers were uniformly reluctant to serve Muslim areas, you would not see positive rural coefficients. The flip points to an urban-specific confounder. Muslim neighborhoods in Indian cities are disproportionately old-city areas: the lanes behind Jama Masjid in Delhi, the old quarters of Lucknow, the inner wards of Ahmedabad. Dense blocks with narrow streets, limited open parcels, and high construction costs, where the probability that any 500-person block hosts a facility is mechanically lower.
The paper does not frame these results as a falsification of the discrimination interpretation. It presents private-facility patterns alongside public ones as additional evidence of the same phenomenon and mentions "limited ability to pay" as one possible explanation (footnote 5). The private-facility test, the urban-rural sign flip, and the Appendix A.5 consumption-control collapse all point the same way, but the paper does not connect them. Nor does it run the Table 6 regressions with consumption controls, which would be decisive. If the SC private-facility gap shrinks with consumption controls, the paper is a poverty story. If the SC gap survives but the Muslim gap does not, paralleling Appendix A.5, that would point to something specific to SC neighborhoods beyond poverty. The test is in the data.
The raw national comparison the paper does not report
The within-town framing does more work than most readers realize. The town fixed effects force every comparison to be within the same local government jurisdiction. For the paper's most-cited infrastructure outcome, the national comparison goes in the opposite direction.
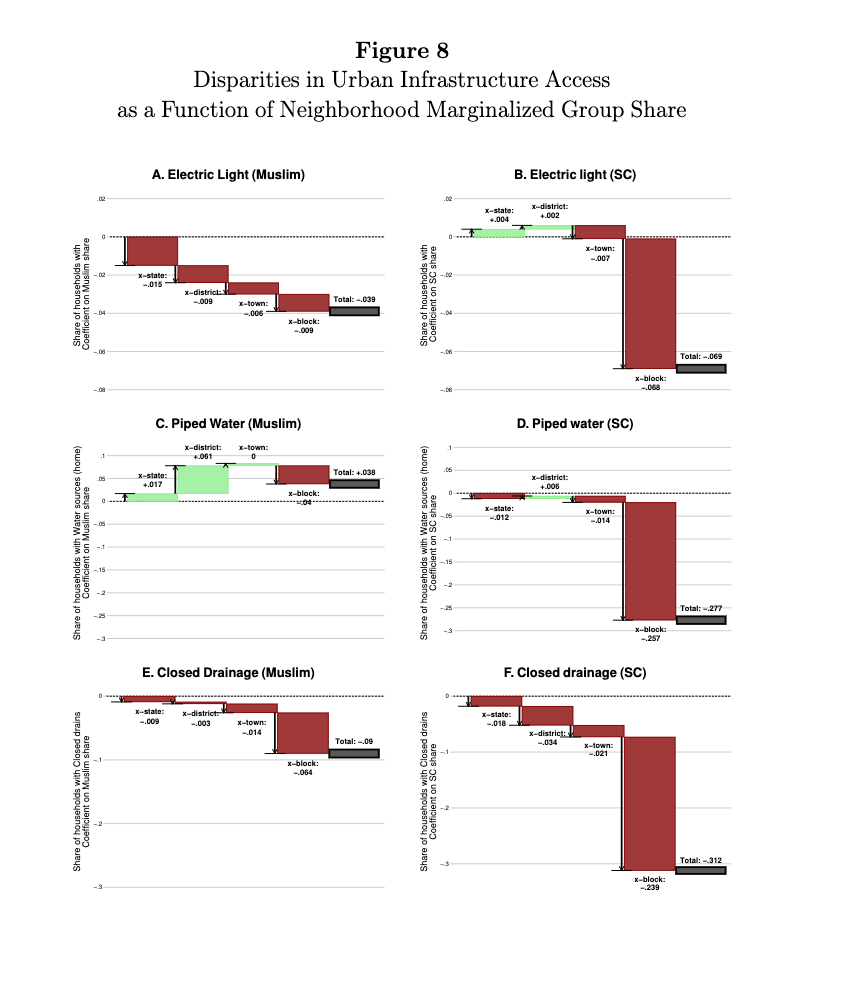
Figure 8 Panel C decomposes the piped water gap into four additive components: cross-state, cross-district, cross-town, and within-block. The within-block coefficient is −0.04. But the cross-state component is +0.017 and the cross-district component is +0.061, both positive. Muslims live in more urban states and more urban districts, and urban areas have dramatically more piped water. The cross-town component is zero. The total is +0.038. Muslim neighborhoods nationally are 3.8 percentage points more likely to have piped water than non-Muslim neighborhoods.
The paper's headline: "a 100% Muslim neighborhood in the same city is 10% less likely to have piped water." The raw national comparison, visible in Figure 8C but never stated in the text: Muslim neighborhoods are more likely to have piped water. And Appendix A.5 shows the within-town deficit itself collapses to +0.008 with consumption controls. The full sequence for piped water: raw national +3.8pp, within-town −4.0pp, within-town with consumption controls +0.8pp. The paper reports only the middle number.
Compare SCs. Figure 8 Panel D: cross-state −0.012, cross-district +0.006, cross-town −0.014, within-block −0.257, total −0.277. Negative at every level, driven by the within-block component, and surviving consumption controls in Appendix A.5. The Muslim infrastructure gap is a within-town poverty artifact that reverses sign nationally. The SC infrastructure gap is a deep, persistent disadvantage at every level of aggregation. Presenting them as parallel instances of the same phenomenon obscures the most important finding in the paper's own figures.
The SECC records piped water, electricity, and closed drainage at the household level, and the authors have Muslim classification for every individual. The simplest possible table, the unadjusted national cross-tab of Muslim versus non-Muslim piped water rates, is not in the paper. It would show Muslims ahead. A 2024 analysis of NFHS-5 data found that Muslim households are 14% more likely to have improved sanitation than Hindu households in unadjusted comparisons (Scientific Reports, 2024).
How the paper is cited, and what remains on the authors' own website
The most consequential gap between the paper and its public life involves results the paper has withdrawn. The 2022 working paper reported that children in minority neighborhoods attain less schooling even after controls (2022 working paper). The February 2026 NBER version removes these results, explaining in footnote 7 that the authors "lack the data to distinguish whether these outcome disparities are caused by unequal service access, discrimination, or just sorting." But the Development Data Lab website (devdatalab.org/segregation), dated June 2023, still states: "Children in Muslim neighborhoods fare even worse, getting 2.2 fewer years of schooling than children in non-marginalized neighborhoods." Muslim Network TV and Madhyamam reported the "two fewer years" figure in February 2026 (Muslim Network TV; Madhyamam). Neither indicates that the authors withdrew the results.
The coverage that does engage the current paper's findings consistently upgrades them. Descriptive associations become causal claims: The Print says segregation "directly affects" who gets services (The Print, February 2026). Block-level hosting becomes physical access: The Print's lede describes residents who "send children miles away for school," though the paper cannot measure distance. Correlations become intent: the Pearson Institute's summary says facilities are "systematically allocated away from" minority neighborhoods (Pearson Institute), implying deliberate decisions the paper does not identify. And in academic citations, the language escalates further: Saba and Gupta (2025) title their own paper "Residential Apartheid in India" (Urban Studies).
The responsibility is not solely the media's. The authors' own website advertises withdrawn results. Their most-quoted finding corresponds to about 1 percentage point on a 2% base, a context no outlet provides. Their most-cited infrastructure result is a within-town coefficient whose raw national comparison, in their own Figure 8, goes the other way. When a paper leads with its least robust finding and places the sign reversal in a figure and the null in an appendix, some of the distance between paper and reception is built into the paper itself.